


AAO Exam-CT 7: Quant (DI - Bar Graph)
AAO Exam-CT 7- Quant (DI - Bar Graph)

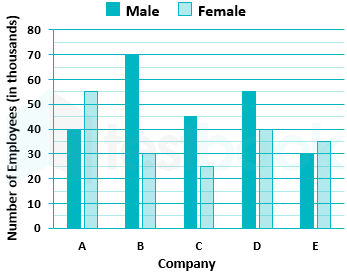
1. Direction∶ Read the following graph carefully and answer the following questions∶
-
50000
-
61000
-
51000
-
59000
Total number of female employees of companies (in thousand) = 55 + 30 + 25 + 40 + 35
⇒ 185000
Total number of male employees of companies (in thousand) = (40 + 70 + 45 + 55 + 30)
⇒ 240000
Required difference = 240000 - 185000 ⇒ 55000
2. Direction∶ Read the following graph carefully and answer the following questions∶
-
29%
-
28%
-
30%
-
26%
Calculation∶
Total number of male employees of companies = 40 + 70 + 45 + 55 + 30
⇒ 240 thousands
Male employees of a company D = 55 thousand
Required percentage = (55 / 240) × 100
⇒ 22.91% ≈ 23% ∴ The required percentage is 23%
3. Direction∶ Read the following graph carefully and answer the following questions∶
-
88000
-
81000
-
80000
-
87000
Calculation∶
Total number of female employees of companies = (55 + 30 + 25 + 40 + 35)
⇒ 185 thousands
Total number of male employees of companies = (40 + 70 + 45 + 55 + 30)
⇒ 240 thousands
Total employees in five companies = 185 + 240
⇒ 425 thousands
Required average = 425 / 5
⇒ 85 thousands
∴ The required average is 85 thousands
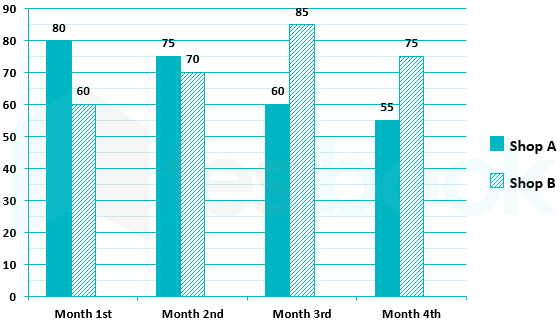
4. Direction: The given bar graph shows the number of pens sold by two shops A & B in four consecutive months. Study the following data and answer the following questions:
-
27 : 28
-
29 : 30
-
26 : 27
-
None of these
Number of pen sold by shop A in 1st month = 80
Number of pen sold by shop A in 3rd month = 60
Total number of pen sold by shop A in 1st and 3rd month = 80 + 60 = 140
Number of shop B in 2nd month = 70
Number of shop B in 4th month = 75
Total number of pen sold by shop B in 2nd and 4th month = 70 + 75 = 145
Ratio of Total number of pen sold by shop A in 1st and 3rd month : Total number of pen sold by shop B in 2nd and 4th month = 140 : 145 = 28 : 29
∴ the required ratio = 28 : 29
5. Direction: The given bar graph shows the number of pens sold by two shops A & B in four consecutive months. Study the following data and answer the following questions:
-
85
-
72
-
78
-
None of these
Total numbers of pen sold by shop A in 1st and 3rd month = 80 + 60 = 140
Total numbers of pen sold by shop B in 3rd and 4th month = 85 + 75 = 160
Total numbers of pen sold by shop A in 1st and 3rd month and shop B in 3rd and 4th month = 140 + 160 = 300
Average = 300 / 4 = 75
∴ the required average = 75
6. Direction: The given bar graph shows the number of pens sold by two shops A & B in four consecutive months. Study the following data and answer the following questions:
-
37.5%
-
42.5%
-
47.5%
-
None of these
Number of pens sold by shop A in 1st month = 80
Number of pens sold by shop A in 3rd month = 60
Percent pen sold in month 1 is more than pens sold by shop A in 3rd month = (20/60 )× 100 = 1/3 = 33.33%
7. Direction: The given bar graph shows the number of pens sold by two shops A & B in four consecutive months. Study the following data and answer the following questions:
-
25
-
20
-
10
-
None of these
Number of pen sold by shop A in 3rd month = 60
Number of pen sold by shop B in 3rd month = 85
Total number of pen sold by shop A and shop B in 3rd month = 60 + 85 = 145
Number of pen sold by shop A in 4th month = 55
Number of pen sold by shop B in 4th month = 75
Total number of pen sold by shop A and shop B in 4th month = 55 + 75 = 130
Difference between number of pen sold A and B in 3rd month and 4th month = 145 – 130 = 15
∴ the required difference = 15
8. Direction: Study the graph carefully and answer the questions given below it.
-
In 2013
-
In 2102
-
In 2011
-
In 2014 and in 2013
Given:
Insurance amount increase in 2012: Rs. 2500
Insurance amount increase in 2014: Rs. 5000
Calculation:
In 2014: (5000 / 2500) ![]() 100
100
= 200%
In 2012: (2500 / 2500) ![]() 100
100
= 100%
9. Direction: Study the graph carefully and answer the questions given below it.
-
In 2012
-
In 2013
-
In 2011
-
In 2011 and In 2012
Given:
In 2014: Rs. 10,000 – Rs. 2500
= Rs. 7500
10. Direction: Study the graph carefully and answer the questions given below it.
-
Rs. 3456
-
Rs. 7890
-
Rs. 4560
-
Rs. 3455
Given:
Amount spent on food in 2011; 2012; 2013 and 2014 is 7500; 7500; 10,000 and 7500
Calculation:
(7500 + 7500 + 10,000 + 7500) / 4 =32500 / 4 = 8125