


AAO Exam-CT 10: Quant (DI - Line Graph)
AAO Exam-CT 10- Quant (DI - Line Graph)

1. Directions: Study the chart and answer the following questions.
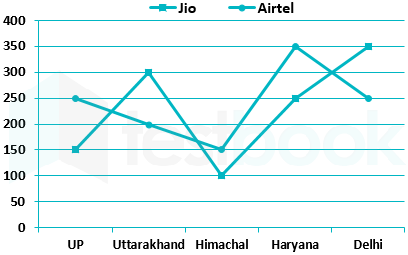
The line graph show number of Jio and Airtel users in 5 different states.
How many total Airtel users are there in all five states together?
-
1250
-
1150
-
1000
-
None of these
Given:
Number of Airtel users in UP = 250
Number of Airtel users in Uttarakhand = 200
Number of Airtel users in Himachal = 150
Number of Airtel users in Haryana = 350
Number of Airtel users in Delhi = 250
Calculations:
Total Airtel users in all five states together = 250 + 200 + 150 + 350 + 250
⇒ 1200
∴ Total Airtel users in all five states together are 1200
2. Directions: Study the chart and answer the following questions.
The line graph show number of Jio and Airtel users in 5 different states.
-
900
-
600
-
200
-
None of these
Given:
Number of Jio users in Delhi = 350
Number of Jio users in Uttarakhand = 300
Number of Jio users in Haryana = 250
Formula used:
Average = Sum of values/Number of values
Calculations:
Average of Jio users in Delhi, Uttarakhand and Haryana = (350 + 300 + 250)/3
⇒ 900/3
⇒ 300
∴ The average of Jio users in Delhi, Uttarakhand and Haryana is 300
3. Directions: Study the chart and answer the following questions.
The line graph show number of Jio and Airtel users in 5 different states.
What is the ratio of Jio users in Delhi to Airtel users in UP?
-
8 : 5
-
5 : 8
-
5 : 7
-
None of these
Given:
Number of Jio users in Delhi = 350
Number of Airtel users in UP = 250
Calculations:
Ratio of Jio users in Delhi to Airtel users in UP = 350 : 250
⇒ 7 : 5
∴ The ratio of Jio users in Delhi to Airtel users in UP is 7 : 5
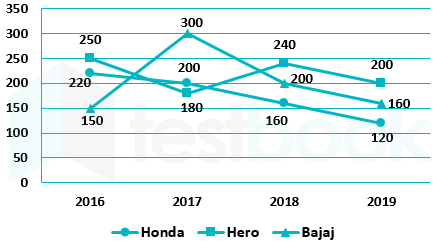
4. Direction: Following line graph shows the number of bikes sold by different companies in different years.
-
3 : 8
-
5 : 7
-
6 : 1
-
5 : 3
Let the price of hero bike be 100a so, price of Honda bike is 120a
Revenue generated by hero bike in 2017 = 100a × 180
Revenue generated by Honda bike in 2017 = 120a × 200
∴ according to question
120a × 200 : 100a × 180
⇒ required ratio 4 : 3
5. Direction: Following line graph shows the number of bikes sold by different companies in different years.
-
650
-
800
-
900
-
850
Bikes sold in 2018 = 160 + 240 + 200 = 600
⇒ Required solution = 600/(100 – 20) × 100
600/80 × 100 = 750
6. Direction: Following line graph shows the number of bikes sold by different companies in different years.
-
24 : 31
-
23 : 30
-
31 : 11
-
none of these
Bikes sold in year 2016 = 220 + 250 + 150 = 620
Bikes sold in year 2019 = 120 + 200 + 160 = 480
∴ Required ratio = 31 : 24
7. Direction: Following line graph shows the number of bikes sold by different companies in different years.
-
30%
-
45%
-
50%
-
20%
Bikes sold by hero in 2016 = 250
Bikes sold by Bajaj in 2016 = 150
Sum of bikes sold by hero and Bajaj in 2016 = 250 + 150 = 400
Bikes sold by Bajaj in 2017 = 300
∴ Required percentage = (400 – 300)/300 × 100 = 1/3 × 100 = 33.33%
8. Directions: Study the following data and answer the following questions:
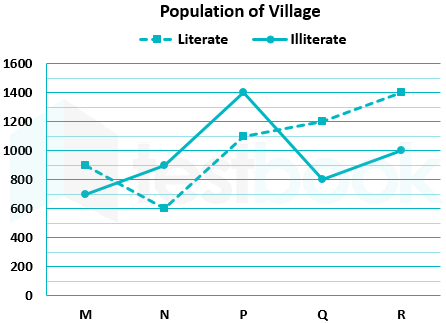
Following line graph shows the literate and illiterate population of five villages.
Total population = literate population + illiterate population
-
1 : 3
-
6 : 7
-
9 : 1
-
8 : 9
Given:
Total population of village N = 600 + 900 = 1500
Total population of village R = 1400 + 1000 = 2400
Required ratio =
= 1500 : 2400
= 5 : 8
9. Directions: Study the following data and answer the following questions:
Following line graph shows the literate and illiterate population of five villages.
Total population = literate population + illiterate population
-
75%
-
55%
-
65%
-
70%
Given:
Total population of village Q = 1200 + 800 = 2000
Total literate population of village Q = 1200
Required percentage =
= 1200/2000 × 100
= 60%
10. Directions: Study the following data and answer the following questions:
Following line graph shows the literate and illiterate population of five villages.
Total population = literate population + illiterate population
-
1100
-
1200
-
1250
-
1360
Given:
Total literate population of five villages =
= 900 + 600 + 1100 + 1200 + 1400 = 5200
Required average = 5200/5 = 1040